Forecasting for Any Use Case
{color=#FFFFFF, opacity=100, rgba=rgba(255, 255, 255, 1), rgb=rgb(255, 255, 255), hex=#FFFFFF, css=#FFFFFF}
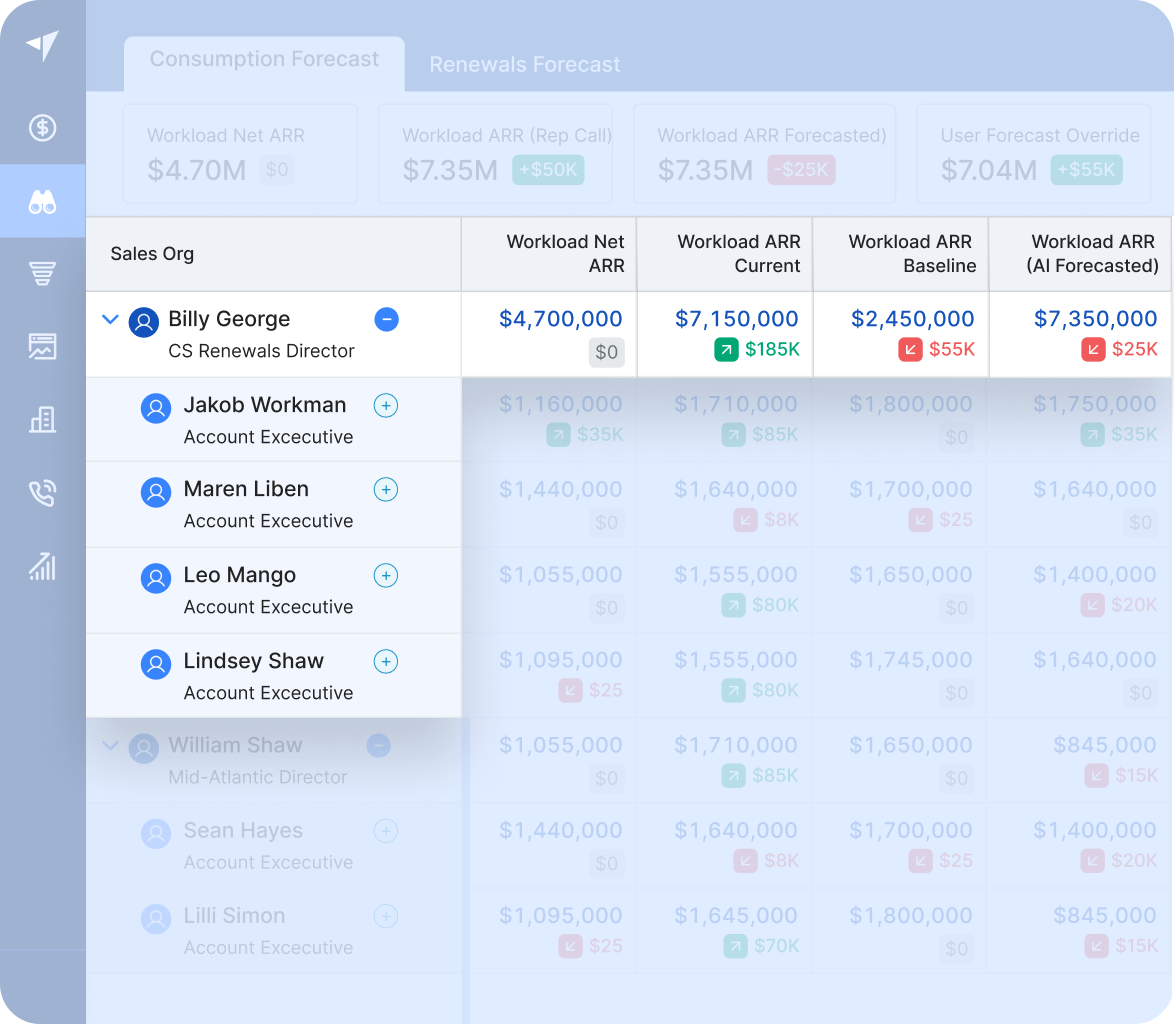
Precision forecasting for every revenue team.
Build unique forecasting models for Sales, CS, Marketing, and PLG.
Forecast based on any revenue unit (deals, renewals, expansions, workloads, PLG, credits)
Roll up the forecast via any hierarchy (sales team, account, product set, feature set)