


Topics covered in this article
Understand the 10 KPIs to Track to Ensure Forecast Accuracy
The one way to guarantee an accurate sales forecast is to properly triangulate and verify your prediction. After all, if you are measuring sales performance, you also should be monitoring forecast performance.
When it comes down to what KPIs to use, operations leaders who regularly achieve a 95% (or greater) forecast accuracy swear by the following 10 metrics.
- Current Quarter Pacing
- Historical Pacing
- AI Projections
- New Pipeline Expected
- Pipeline Coverage
- Next Quarter Pipeline
- Committed/Best Case Roll-Ups
- Manager/Rep Roll-Ups
- Submission and Override History
- Big Deal Dependence and Slips
Here’s how you can use them to triangulate your forecast for your most accurate sales projection yet.
Current Quarter Pacing
Current quarter pacing is simply the amount of revenue your team has created in your current quarter, versus the revenue goal.
This can be further broken down to month-by-month or week-by-week pacing. Then, use the breakdown to determine if your team is on track to meet their target, or if more revenue must be generated. If the team is lagging behind their weekly or monthly targets, then your forecasted number may not be met and requires adjustment.
Historical Pacing
This KPI uses historical data on revenue generated in previous periods. You can use both the forecasted number and final outcome from the same time in the previous year, or even prior quarters.
Historical pacing can be difficult since it will not take into account additional headcount or different sales tools, but it can be extrapolated on a rep by rep number for better comparison.
Historical pacing can also be used with your current pacing to examine your team’s performance on a monthly or weekly basis for more granular analysis. If your current quarter lags behind similar time periods, then your forecast is likely not accurate.
AI Projections
Artificial intelligence is incredibly powerful and helpful for all things sales. In a forecasting context, AI can analyze an incredibly large and diverse dataset to find correlations.
With a platform like BoostUp, the AI will examine sales interactions, including emails, phone calls, and meetings, as well as the conversations that take place within them to judge buyer engagement and sentiment. The AI then builds its own forecast based on what it discovers.
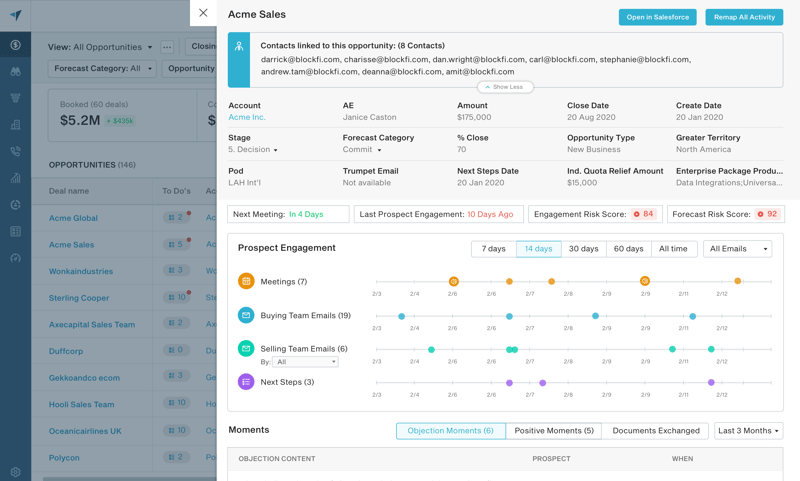
You can compare which opportunities the AI deems risky with what your sales team believes will close. If there are large discrepancies, your forecast is at risk.
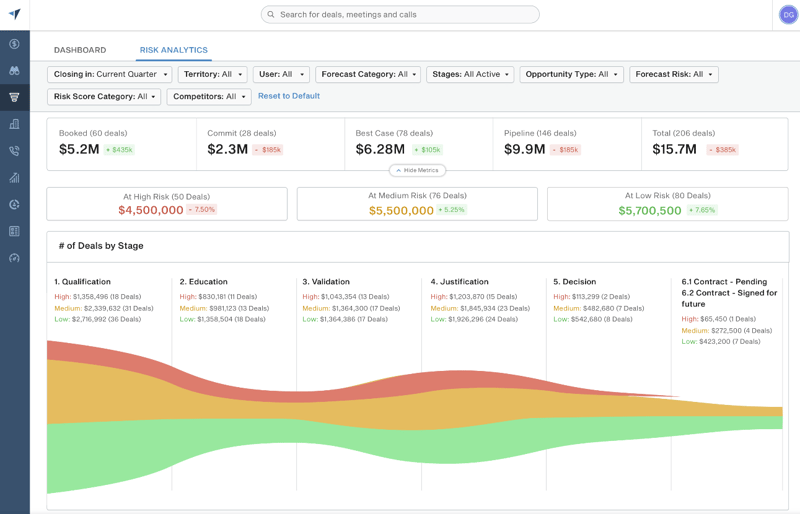
Pipeline Coverage
Even if your team hasn’t signed or committed enough deals to hit your forecasted number, there may be enough revenue in your pipeline to bring you to your goal.
Examine the total value of your pipeline to see if it is trending upward, downward, or remaining the same, and if there is enough potential revenue to meet your targets.
AI-generated risk scores and projected outcomes can be extremely useful in sorting out which deals will close. If there is not enough, your team needs to find new revenue, or your forecast must be adjusted.
New Pipeline Expected
If your team doesn’t already have enough committed revenue to meet your forecasted number, the expected pipeline metric will tell you if there is enough coming pipeline to meet your goals.
With this number, the crucial component is exactly how much of that pipeline is expected to close in your given quarter. You may have enough expected revenue, but you must ensure there is enough committed revenue.
The AI-generated risk score can help determine exactly which deals will close when you need them to.
Next Quarter Pipeline
While the current quarter may be your focus, the next one is always closer than it may feel. To consistently hit your forecast, you must constantly be thinking about how to build new sales pipeline for the next quarter.
To meet your annual or semi-annual goals, you should always watch the revenue that is slated for the next quarter. Especially in organizations with longer sales cycles and complex products, it may take months before a deal can be considered “ready”.
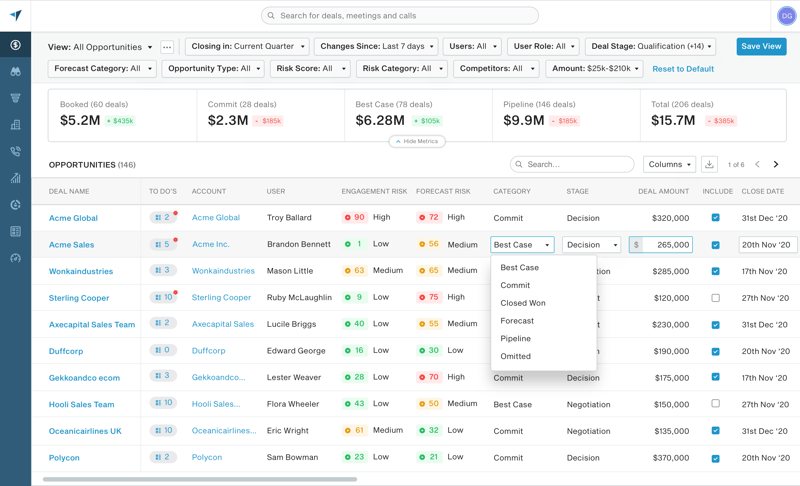
Committed and Best Case Rollups
Bottom-up rollups of committed and best-case deals are the most common way of forecasting today and can be used to verify your forecast.
Traditionally, this is how the majority of salespeople submit their forecast, but it can also be used as a factor to confirm the accuracy of your forecast.
Take the total roll-up of what reach rep believes they will close, and their best-case scenario and look for discrepancies between that number and your forecast, your accuracy may be at risk.
Manager and Rep Forecast Calls
A great way to look for inaccuracies in the bottom-end of your forecast is to inspect the differences between your manager and sales rep calls.
Examine what your managers are calling for the quarter, versus what the reps themselves are calling. How far are they, and what deals are included or excluded?
Submission and Override Histories
In the same vein as your manager and rep call, examine what managers override rep submissions on both deals and deal amounts.
Look at what was changed and by how much. This is a key indicator of differing perspectives and may show that some opportunities may not be won.
Big Deal Dependence and Slippage
Is your forecast largely dependent on just a few large deals? If one slips, you may miss your mark.
Examine your forecast to determine what percentage depends on outsized deals, pay special attention to them, and watch how they progress. As time continues, work to decrease your dependence on large deals.
Want all of these metrics but none of the work? BoostUp offers these forecasting KPIs directly out of the box.
Want to experience BoostUp for yourself? Take the self-guided product tour.
FAQ - Sales Forecast Accuracy Metrics
What is Current Quarter Pacing?
Current quarter pacing measures the revenue generated in the current quarter against the set revenue goal. It is broken down into monthly or weekly pacing to monitor if the sales team is on track to meet targets.
What is Historical Pacing?
Historical pacing involves comparing current sales performance with historical data from previous periods, such as the same quarter in the previous year or earlier quarters. This metric helps identify trends and patterns in sales performance, improving forecast accuracy.
How does AI enhance sales forecast accuracy?
AI-powered sales projections enhance accuracy with:
- Predictive Analytics: AI algorithms analyze large amounts of historical sales data, market trends, and customer interactions to identify patterns and generate predictive insights. This allows for more accurate sales forecasting.
- Dynamic Forecast Adjustments: AI continuously updates forecasting models in real-time as new data becomes available.
- Lead Prioritization: AI-driven lead scoring evaluates the potential success of leads, enabling sales teams to focus on the most promising opportunities.
- Risk Detection and Mitigation: AI identifies potential risks within the sales pipeline, such as deals that are likely to slip or encounter obstacles. By highlighting these risks early, sales teams can proactively address issues and develop strategies to mitigate them.
Why is the Sales Forecast KPI: Next Quarter Pipeline Important?
Next quarter pipeline involves monitoring the revenue slated for the upcoming quarter. This metric is critical for continuous pipeline building and preparedness for future sales cycles. For organizations with longer sales cycles and complex products, ensuring a healthy next quarter pipeline is essential for achieving annual or semi-annual sales targets.
What is Pipeline Coverage?
The sales forecast KPI pipeline coverage measures the total value of opportunities in the sales pipeline relative to the sales target. This metric helps determine if there is sufficient potential revenue to meet targets. Key components include:
- Total Value of Opportunities: The aggregated potential revenue from all sales opportunities in the pipeline.
- Sales Target: The revenue goal set for the specific period, which could be quarterly, semi-annual, or annual.
- Trend Analysis: Tracking if the pipeline value is increasing, decreasing, or stable.
How to Calculate Pipeline Coverage?
Pipeline coverage can be calculated using the formula:
Pipeline Coverage = Total Value of Opportunities/Sales Target
For example, if the total value of opportunities in the pipeline is $500,000 and the sales target is $250,000, the pipeline coverage would be:
Pipeline Coverage = 500,000 / 250,000 = 2
What is a Good Pipeline Coverage Ratio?
There is no universal ideal pipeline coverage ratio that applies to every business. An acceptable ratio depends on factors like your average sales cycle length, typical win rates, and deal values.
However, most sales leaders agree that a pipeline coverage ratio between 3x and 4x your target is a good benchmark to aim for. This allows for adequate opportunities to make up for the inevitable deals that won't close. If your ratio falls below 3x, it may signal your pipeline is undersized and you risk missing your goals.
What is Big Deal Dependence and Slippage?
Big deal dependence and slippage assess the reliance on a few large deals for meeting the forecast. High dependence on large deals poses a risk if any of them slip.
Key considerations include:
- Dependence Ratio: Percentage of forecast reliant on large deals.
- Forecast Accuracy: A high dependence ratio and slippage directly impact the accuracy of sales forecasts, as anticipated revenue may not be realized in the expected timeframe.
- Monitoring: Closely track the progress of big deals, ensuring frequent check-ins and updates to mitigate risks associated with slippage.
How Can Manager and Rep Forecast Calls Improve Accuracy?
Manager and Rep Forecast Calls involve comparing forecasts from sales reps and their managers. Analyzing the differences helps identify potential inaccuracies and understand the reasons behind varying expectations for specific deals.

-Photoroom.png)