


Topics covered in this article
With the advancements of technology, forecasting has become a perfect blend of skill or craft and science. Organizations are now looking at AI to augment and provide a second validation of the forecast number. However, as B2B organizations, especially SaaS, mature, grow and scale into new lines of business, new industries, and new business models, forecasting becomes much harder, more time consuming, and potentially less accurate.
How do you achieve higher levels of accuracy while removing a lot of the administrative data collection and reporting burden from your operations team? It starts with understanding where you are today, where you need to be, and what processes, techniques, and solutions are required to achieve 95% or greater forecast accuracy.
We recently had the please of speaking with this esteemed panel of Revenue Operations leaders and practioners:
- Sharad Verma, CEO & Co-Founder at BoostUp.ai
- Mike Sitter, Vice President of Business Operations at Sisense
- Mark Turner, Global Head of Sales Operations and Enablement at Canva
- Kory Geyer, Vice President of Revenue Operations at 6sense
They unpacked the different levels of forecasting, how to achieve higher levels of forecast accuracy as you grow and when to invest in a dedicated forecasting solution. Points of discussion included:
- Forecast maturity curve and the levels of forecasting accuracy
- How to move up the forecast maturity curve
- When to invest in a dedicated forecasting solution
- Key outcomes of a predictive forecasting solution
Unveiling the BoostUp Forecast Maturity Curve
In this forecasting masterclass section, Sharad Verma, CEO & Co-Founder of BoostUp.ai, unveils the BoostUp Forecast Maturity Curve. In his presentation, he shares the processes, forecasting rigor, the metrics, and the tooling you need as you work to advance up the forecast maturity curve. The BoostUp Forecast Maturity Curve has four maturity levels, and as you advance, your forecast accuracy becomes more and more accurate. In addition, BoostUp looks at key processes and metrics needed as you advance.
Level 1: Bottom's Up Forecasting
Process:
- Pipeline stages or forecast categories based
- Needs high data input discipline at the deal level from reps
Metrics:
- Stage-weighted pipeline
- Weighted-category based forecasts
- In-quarter pipeline creation and conversion rates
Level 2: Top-Down and Bottom's Up Forecasting
Process:
- Top-down gut calls where reps and managers call a number
- Keep that number updated on a weekly basis
Metrics:
- Total manager call, total rep call plus,
- Change in calls WoW
- Bottoms up metrics
Level 3: Role-Based and Crowd-Sourced Forecasting
Process:
- Reps/managers validate their gut calls with a set of included deals
- Calls are further validated by manager overrides, solution consulting, and deal team members
Metrics:
- Total override forecast by role (manager, solution consulting, account manager)
- Total “deal included” forecast by role
Level 4: High Frequency or High Fidelity Forecasting
Process:
- Gut call process and targets change to weekly and monthly
- Reps call a separate number for M1, M2, M3, and each week of the quarter
- AI-guided submissions
Metrics:
- Time and pace-weighted forecasts
- In-quarter and next-quarter pipeline creation forecasting
- Targets per product, region, manager, etc.
Listen to Sharad's entire Forecasting Masterclass section here.
Climbing the Forecast Maturity Curve with BoostUp
In the 18 months since Mike has been at Sisense, he shares how they have advanced on the forecast maturity curve, first looking at the statistical, bottoms-up forecast, which was based on the deal probabilities assigned by AE and then looking at weighted pipeline. Senior sales leaders made the forecast call weekly, looking at the current month and current quarter calls. The weekly forecast was collected and rolled up in Google Sheets and then consolidated into Sisense dashboards. This process had some limitations and gaps in which Mike spoke to and has addressed over his time as Sisense:
- Forecast accuracy was less than 80%.
- There was a lack of shared visibility to forecast or no standard KPIs that we measured in the roll-ups.
- There was an inability to "stress test" the forecast with standards KPIs for pipeline coverage, stage progression, and more.
- The process was top-down from an action standpoint, with limited feedback from the sales reps.
Climbing the Maturity Curve
Soon after Mike joined Sisense, they started to act on a key set of processes as they worked to advance on the forecast maturity curve.
- Create a sales process discipline: Set definitions, exit criteria, and systematic stage gates.
- Simplified our forecast definitions: Set forecast calls to "Commit / Most Likely," and created clear, unified forecast categories at the deal level.
- Create an enablement process and cadence: Created a forecast training for senior leadership down to the account executive. In addition, Sisense created a repeatable cadence for forecast reviews at multiple levels (AE to sales manager, manager to senior leadership, etc.) and created a standard agenda for reviewing the forecast.
What's Next for Sisense?
Sisense has an aggressive plan to continue advancing up the maturity curve, leveraging BoostUp.ai as their Forecasting, Revenue Operations and Intelligence platform provider.
They have planned to separate their forecast roll-ups by new logo, expansion, and upsell while leveraging statistical modeling of in-quarter created and closed opportunities. They will leverage collaborative forecasting getting input from sales engineers to validate the placement of deals in the stage/forecast category. Additionally, they will work with customer success to validate win probability for upselling and expansion opportunities, using BoostUp to enable this.
Another key metric they will be using is "stage-based weighted pipeline" to enforce sales process discipline and assign fixed probability scoring based on the sales stage. This will give them a much higher forecasting accuracy and pipeline coverage.
As Sisense launched BoostUp, they received requests from sales engineering, marketing, customer success, BDRs, and other teams to get access to get complete visibility into each deal and associated activity and risk.
"This allows the Sisense team to get a lot more collaborative across the revenue team and increase forecasting accuracy as well. BoostUp gives Sisense a single tool to look at deal health and deal progression, which has been extremely gratifying."
Mike Sitter, VP of Businesss Operations at Sisense
Listen to Mike's entire Forecasting Masterclass video here.
Forecast Rigor and Process Drives Forecast Accuracy
Mark has had the privilege to work at some fantastic companies and realized that he has been in forecasting in many capacities, from material demand in a production facility, capacity planning in a consulting environment, or sales forecasting in a technology company.
As Mark looks back on his career so far, he speaks the different levels of forecasting strength in terms of maturity. From Sapient, a level 4 on BoostUp's Forecast Maturity Curve, leveraged over ten years of data to inform the forecast. In addition, they built in a lot of forecasting processes and rigor, which was a key driver for achieving high forecast accuracy levels. At Sapient, they did 3-4 calls a week, used stage-drive forecasts, and used a model to validate the forecast.
At Acquia, Mark's team was a level 3 on BoostUp's Forecast Maturity Curve. They did two calls a week, forecast using forecast categories, and use some lightweight, historical model validation to validate the forecast. A key driver for us was to build a standard process, review risk, look at changes week over week, and relieve any variance in the forecast.
For Canva, one of the first things he did was roll out a standard forecast terminology and documentation to ensure that everyone spoke the same language. Right now, we are very ad-hoc and using Google Sheets today, where it's very manual. There is very little transparency or context into overrides or the forecast call. Canva would be a level 2 on BoostUp's Forecast Maturity Curve, where they look at a top-down and bottoms-up forecast call.
Canva is looking at how best to scale towards level 3, ultimately, level 4 on the forecast maturity call in the coming months
What does Forecast at Canva look like tomorrow?
Forecasting at Canva looks very different when they look toward the near future. They plan to roll out a bottoms-up forecast at the manager level, validated with forecast category and top-down momentum. Additionally, they will look at the manager and rep-level forecast validated by the forecast category, which will focus on current and the next quarter pipeline and forecast and include pipeline generation and conversion targets.
Mark also shares his team's forecast process. He indicates that a strong process and having rigor around the process ultimately help improve team forecast accuracy.
- Monday: Managers meet with their teams. Managers provide their forecasts to regional leads.
- Tuesday: Regional leads provide forecast to the Head of Sales
- Wednesday: Head of Sales digs in and validates the forecast. Sales Operations provides support data on the forecast.
- Thursday: Head of Sales shares the forecast numbers to the CXOs.
- Friday: Reps prepare Salesforce for Monday discussions.
Sharad asks, "What's the role of RevOps in forecast meetings?"
"The role of Revenue Operations is to use data to identify opportunities that seem to be misaligned. Meaning if this deal is expected to close but the necessary things are not done as pre-requisites, flagging that to the leadership team to investigate further."
Mark Turner, Global Head of Sales Operations and Enablement at Canva
Listen to Mark's entire Forecasting Masterclass section here.
Forecast Discipline and AI Drives Forecast Accuracy
Kory has been at 6sense for three years and has seen their sales organization grow from 10 to about 200 reps. This growth required them to build forecast discipline and forecast tools to help them scale. This made Kory think of two themes:
- Forecasting doesn't start with sales: It starts with Marketing and BDRs before it ever gets to sales. Kory indicates that the same measurement measures each team - pipeline created and closed-won revenue. This creates accountability and collaboration across their entire revenue. He noted that you would have difficulty determining who is running sales if you were to go onto the weekly sales and marketing calls. That's the kind of collaboration and team alignment that 6sense strives to achieve.
- Discipline drives accuracy: Kory has done a complete wholesales change in their process and revenue model twice in 3 years and additionally pushed out minor version releases and certification around the change. This discipline and cadence really help 6sense drive forecast accuracy.
Kory shares his revenue operations model. This is their single model across marketing, sales and customer success. First, they agree on who we should go after as a team. We then measure how many people are in the awareness and consideration stage. They are very much measuring conversation rates and forecasting across each stage.
Metrics that Matter for 6sense
Kory shares the key metrics that they look at across marketing and sales/customer success. He notes that, especially on the marketing side, they are not your traditional metrics like MQLs; it's focused on engagement and AI prediction.
Marketing looks at:
- Advertising View-Thru Rate
- Unique Web Visitors by Page
- Program Engagement by Persona
- Campaign Influence Amount
- Unique Contacts Influenced
- AI Prediction
Sales and Customer Success look at:
- Pipeline Coverage
- Forecast History/Accuracy
- Pipeline Flow
- Velocity Risk
- Churn Risk
- AI Prediction
Kory also shared his sales forecast cadence with the team. He details that this is a key driver for them in achieving forecasting rigor through discipline and a defined process. This, in turn, helps them become more accurate in the forecast and advance up the forecast maturity curve. Here's what it looks like.
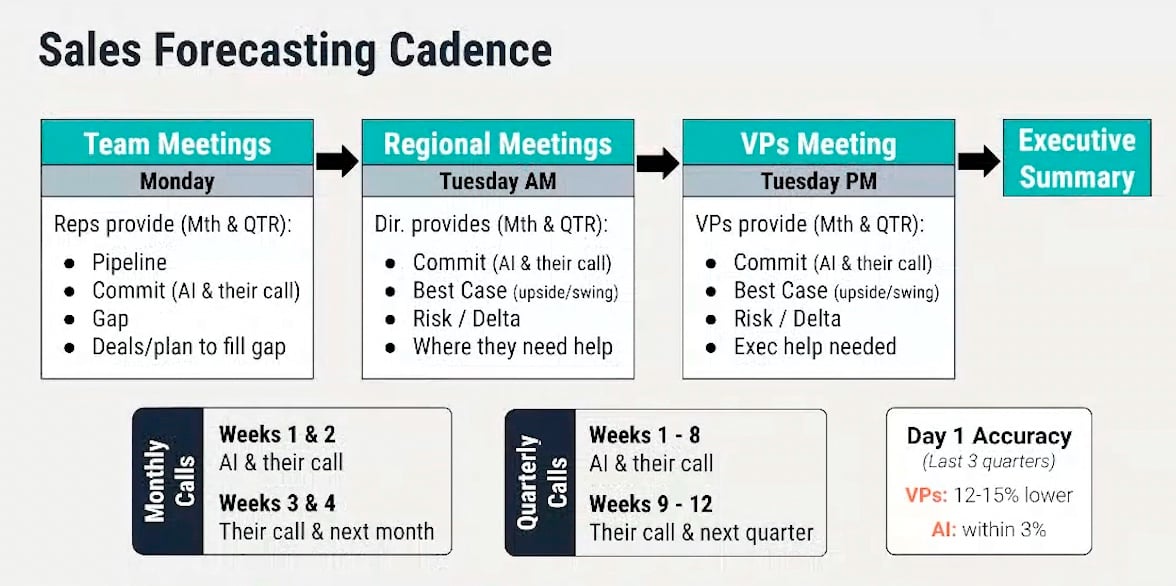
Listen to Kory's entire Forecasting Masterclass section here.
Access BoostUp's Forecasting Masterclass Series On-Demand
If you found the roundtable and this summary valuable, please check out our library of over 25 on-demand forecasting masterclass videos. We cover topics that include forecasting best practices, key KPIs and processes, standardization and forecast rigor, the forecast maturity curve, and much more.
Listen to top revenue operations practitioners and leaders speak on forecasting best practices to improve forecast accuracy.
Start learning today!

-Photoroom.png)