


Topics covered in this article
BoostUp is proud to introduce the "Sankey Bolt" as the newest, quickest, and most effective way to gather insights for sales process improvement, pipeline progression, forecasting stage progression, and correlation.
The BoostUp Sankey Bolt Report allows you to view your entire pipeline's flow, dig into each specific category, then inspect the individual deals, and engagements that occurred within them, in just a few clicks.
The Sankey diagram has long been employed within the fields of science and engineering for its ability to display flow data in a highly readable and actionable manner. However, now that the sales process is more dynamic than ever, teams require a way to truly understand how opportunities move through their process, where they win, and why they lose.
With Sankey Bolt, sales teams can now answer their most pressing issues:
- Loss analysis - In which stages are you losing deals?
- Early-stage analysis - Where are your discovery stage deals ending up during the quarter?
- Late-stage analysis - Are your late-stage deals closing or slipping?
- Lead progression analysis - What happened to deals sourced by a particular campaign/channel?
Forever gone are static reports and limited insights. Instead, the Sankey Bolt provides real-time and instantly digestible sales process analysis and complete insights into your pipeline and forecasting movement and health. In a single view, understand exactly where deals are coming from, how they move, and how they will impact your forecast.
BoostUp’s Sankey Bolt is the first chart that is interactive, clickable, and contextual. Instantly view which deals changed and why, along with unique deal health insights gathered with AI. Use the cohort analysis to see how stages and categories impact the conversion path and get the full context of every deal.
The Sankey chart from BoostUp is a powerful tool for understanding how deals are moving through the process and progressing. It's really effective to use during 1:1s in particular. At the management level, we use it to track movement of key strategic deals. Very excited to see more new innovative features from BoostUp."
- Mike Sitter, VP, Business Operations | Sisense
Challenges Surrounding Forecast Visualization
Organizations have long been stuck with static, screenshotted, and convoluted charts from their CRM. Others have adopted revenue operations and intelligence platforms, only to gain insights into stage progression, but not forecast or category progression. Yet, even with some of the most prevalent RevOps tools on the market, leaders fight to gain full insight into the performance of their sales process, and their forecast is impacted.
While these insights can be useful, they are limited. Modern businesses are more dynamic than ever and need the reporting to match. Leaders do not have time to analyze endless charts, swap platforms, and dig for information. That’s why Sankey’s ability to easily show information, combined with the interactivity, click-ability and level of inspection provided by BoostUp, is so important.
Sankey Bolt Displays Your Sales Process in an Entirely New Way
With just a few clicks, revenue operations, sales operations, sales, marketing, and leadership teams can all now answer questions like:
- What has changed in the pipeline?
- What happened to my January pipeline (cohorts)?
- What happened to all my commit deals? Where are they now?
- What is the source of my current best-case deals? Where did they come from?
- How are deals within each stage progressing?
- How did my January discovery deals progress, and where are they today?
- Finally, what’s the source of my won and lost deals - which stages, which forecast categories?
Sankey Bolt delivers the ability to not only spot the change but to identify the source. See which deals have moved backward, which have progressed, what stage or category the most progression comes from, or where your largest losses are. Then, dive directly into that stage to see specific deals and what happened within them.
Sankey Bolt for Sales Pipeline Progression Analysis
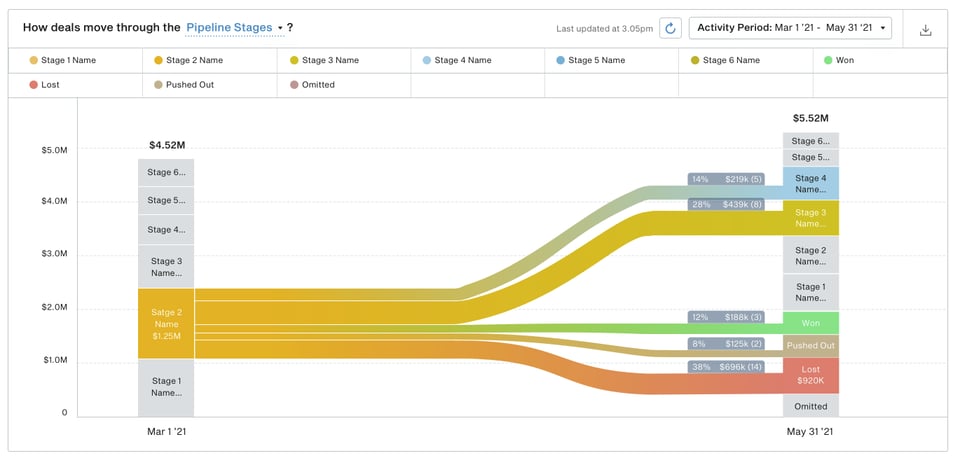
The Sankey Bolt chart provides unparalleled insight into your sales pipeline progression. No longer are you forced to pick percentages from a table or compare charts? With Sankey, you can know exactly how much revenue is progressing, from which stage, and in what direction. Instantly see how your opportunities are progressing down the funnel.
The graph is proportional to the amount of revenue and displays the direction of flow. You can easily see which stage deals have moved through and if they were lost or pushed out. Use this visual to identify stage and pipeline progression and correlation and where there are issues that need to be addressed.
How are my deals moving through the funnel by Pipeline Stages?
Click into any stage or part of the chart to examine the deals within that category from the macro view. View the risk analysis metrics and current status of any deal, and then inspect the deal even deeper and view the specific communications and engagements that occurred within it.
This gives managers and leaders the ability to understand what exactly is happening within their pipeline, identify and improve weak points, and capitalize on strengths to improve sales effectiveness.
For example, teams can perform an early-stage analysis to determine where winning deals are sourced and the optimal path of progression. They can also view a late-stage analysis to see where exactly deals are lost and how they can be improved. Understand where the deal was sourced, how it progressed through the funnel, what actions were performed, and how it impacted the outcome.
Sankey Bolt for Sales Forecasting
The Sankey Bolt also delivers significant value for sales forecasting. The chart can be configured to show exactly how deals progress through your forecast categories so you can understand what exactly will close, and where, and when.
How are my deals moving through the funnel by Forecast Category?
Use the Sankey to see how deals move through the forecast and at what stages they are omitted, committed, or marked as best case. Easily click into each category to view exactly which deals are within it, what has occurred within those deals, and even how to remedy them.
Track the effectiveness of your sales cycle, and address any gaps where deals are lost to ensure you meet your sales forecast. Spot which deals are stagnant or moving backward and use BoostUp’s insights to analyze risk and increase engagement.
The Sankey Bolt is available exclusively within the BoostUp platform, along with contextual deal insights and AI risk analysis to help you make your most accurate forecast, ever. Want to learn more?
-Photoroom.png)